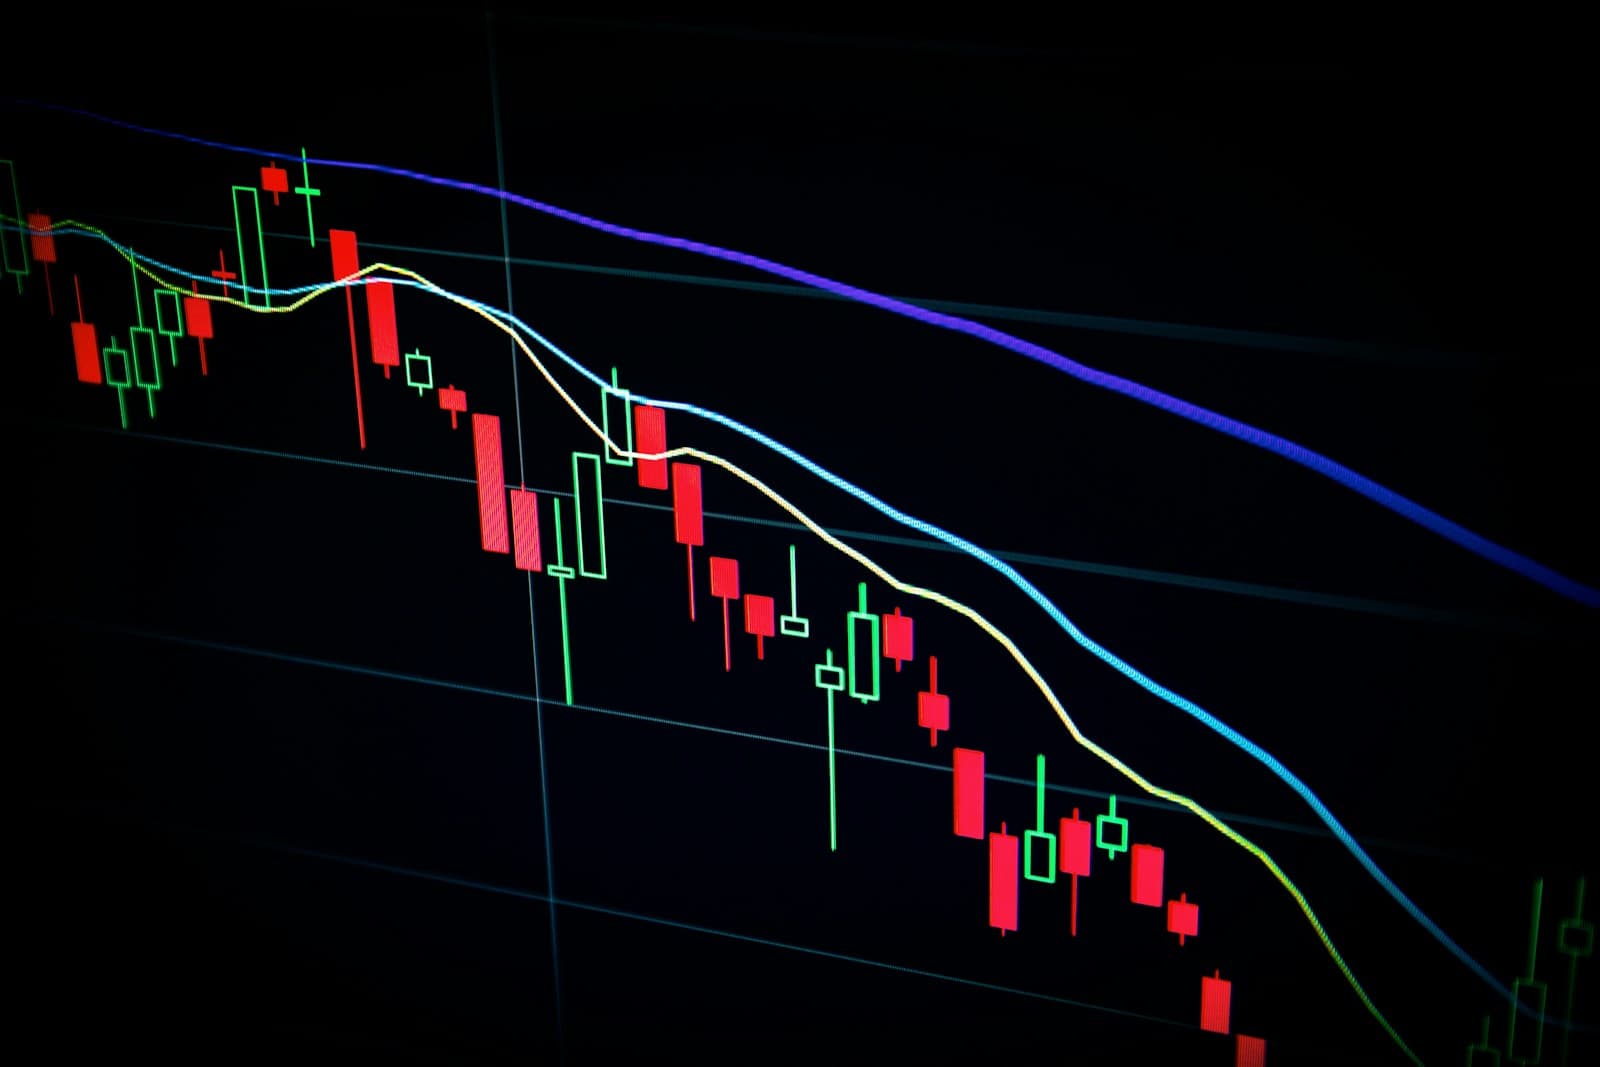

The $2.3 trillion figure attached to Thursday’s US market selloff sounds like money physically leaving the financial system. It is a different measure: Bloomberg reported that the Nasdaq-100 fell 6.4% on November 5, reducing the index’s combined market value by an estimated $2.3 trillion. That is a sharp repricing of listed shares, not a bill that companies suddenly had to pay or a cash balance withdrawn from the market.
The distinction matters for Indian readers following US technology shares through global funds, overseas investing platforms or market news. The headline refers to one index, the Nasdaq-100, rather than every US-listed company. The day was severe across several benchmarks, but each index contains a different mix of businesses and therefore records a different move.
What exactly fell by $2.3 trillion?
The Nasdaq-100 tracks 100 of the largest non-financial companies listed on Nasdaq. It is heavily exposed to large technology and growth companies, which helps explain why it can move more sharply than a broad-market gauge when investors reassess expectations for AI spending, chip demand or future earnings. Bloomberg’s report said the index dropped 6.4% and that the market-value decline was its largest on record.
That is not the same as saying the entire US stock market lost $2.3 trillion. The S&P 500, which covers a broader group of large US companies, fell 4.4% that day, according to the same report. The Nasdaq-100 and S&P 500 overlap in some large companies, but they are not interchangeable measures. A headline should name the index before readers draw conclusions about the whole market.
Why did technology shares come under pressure?
Investors were reassessing the outlook for the AI trade and the enormous data-centre buildout behind it. Those projects need chips, servers, electricity, cooling and long-term financing. When expectations about future spending or policy change, companies connected to that investment chain can reprice quickly, even if their latest reported revenue has not changed overnight.
Bloomberg also reported a 12% fall in a US semiconductor gauge, its steepest one-day decline since the start of the Covid-19 pandemic. That points to concentrated pressure in chipmakers and related technology shares. It does not by itself prove that AI demand has disappeared, that data-centre projects have been cancelled, or that the sector’s long-term earnings outlook has been settled.
Political developments were part of the day’s market narrative, but a market reaction is not proof that a particular rule has been enacted. Traders can move prices while trying to estimate possible future regulation, financing conditions or project delays. Those expectations may later prove right, wrong or more complicated than the first market response suggests.
Why market-value losses are not cash withdrawals
Market capitalisation is generally calculated by multiplying a company’s share price by the number of its shares. If the price falls, the company’s market value falls on paper at the new traded price. That does not mean the company had that entire amount in its bank account or that shareholders collectively sold exactly that much cash.
For example, if a hypothetical company has one billion shares priced at $100 each, its market value is $100 billion. If the share price later trades at $90, the implied value becomes $90 billion. The $10 billion difference describes the repricing of all shares at the latest price. It is not a record of $10 billion being transferred out of the company’s treasury.
Realised gains and losses depend on an investor’s own purchase price, sale price, costs and taxes. Someone who did not sell may see the portfolio value fall on screen without booking a realised loss, while someone who sold at a lower price may lock one in. Index-level market capitalisation is an aggregate measure, not an account statement for each investor.
What Indian investors should check before reacting
Start by identifying what you actually own. A US technology fund, a broad international fund and a domestic Indian equity fund can have very different exposures. Check the fund’s latest holdings, index benchmark, concentration in a few large companies, currency exposure and stated investment horizon rather than assuming every global investment mirrors the Nasdaq-100.
Next, separate the day’s market movement from a change in the underlying facts. A useful review asks whether company earnings, balance sheets, orders, capital spending or guidance have changed, and whether the share price is responding to confirmed information or a scenario investors are debating. One volatile session cannot answer those questions on its own.
Investors can also read our earlier report on Alphabet’s share-price fall and AI-search revenue concerns for a company-level example of how expectations around artificial intelligence can shape a stock narrative. The business details differ, but the broader lesson is to distinguish an operating update from the market’s interpretation of it.
How to read the next market headline
When a report says trillions were wiped out, check four things: which index is being discussed, the measurement period, the percentage change and whether the number refers to market capitalisation or investor cash flows. Also look for the benchmark used for comparison. A Nasdaq-100 decline cannot be directly applied to a portfolio that follows another index or holds a different mix of shares.
For the source figures and the index distinction, see Bloomberg’s report on the November 5 technology selloff. Its reported figures describe that US trading session; they are not a forecast of what the next session or the next year will bring.
Conclusion
The $2.3 trillion headline describes a record market-value decline in the Nasdaq-100 during a steep technology-led selloff on November 5. It is neither a measure of cash drained from companies nor a precise estimate of every investor’s loss. For readers in India, the practical next step is to check the index and holdings behind an investment, then assess the underlying company information before drawing a conclusion from one dramatic market day.